
THE SCIENCE OF PRICING
February 1, 2019 | 17 min to read

Originally printed in the February 2019 issue of Produce Business.
If you cut or raise the retail price of a fruit or vegetable by 10 percent, will the volume demanded move by the same degree?
It would be nice to have an app that could answer this for any product with the scan of a QR code, but in reality neither industry professionals nor the economists who study price elasticity can give a definitive answer.
Data limitations, the fluid nature of demand and the diversity of consumers between locations and stores have much to do with this, but efforts to calculate and forecast elasticity – essentially consumer responsiveness to price – can give retailers a ballpark estimate to work with.
Knowing whether shoppers are fickle or faithful to a product not only helps department executives select the right pricing strategies to maximize returns, but can go a long way in shaping the decision making of growers and marketers.
For many though, the effect of pricing strategies probably feels much like the following analogy from John Pandol, director of special projects at Pandol Bros in Bakersfield, CA: “It’s not like a chess game; it’s more like the break of a billiards table. What’s going to go which way?”
It’s now time to chalk the sticks, because we’re about to find out.
Before looking at studies about specific fresh produce items, a good place to start for an understanding of elasticity is the economic literature, which mostly looks at the category as a whole and measures elasticity in terms of what percentage an item will increase or decrease in consumption for every decrease or increase in price.
“In general you find something that’s in the order of -0.6 or -0.7,” says Brad Rickard, associate professor in applied economics at Cornell University, Ithaca, NY. “It means if the price were to increase by 10 percent, then consumption of that fruit or vegetable would fall by 6 percent or 7 percent.”
This estimate is for the average fruit or vegetable, and shows the sector is well-positioned. While demand for fresh produce is not as inelastic (consumption doesn’t change as much prices go up or down) as meat or grains, it is still an essential part of the shopping basket and holds steady overall. “The price can change quite a bit but it’s still something they demand. It’s something they need to have and consumption doesn’t change that much,” says Rickard.
“Eggs and dairy — and alcohol is another example — are commodities or food items that are more sensitive than fruits and vegetables to changes in price.”
Tatiana Andreyeva, director of economic initiatives at the Rudd Center for Food Policy and Obesity at the University of Connecticut, has conducted meta-analysis into the issue and concurs with Rickard’s summary.
However, she notes some studies suggest an elasticity of up to -1.4, implying a 10 percent drop in price would lead to a 14 percent increase in volume sold.
This ties in with how the academic conversation started to change with the 2010 paper “Demand elasticities for fresh fruit at the retail level”, co-authored by Catherine Durham of Oregon State University (OSU) and James Eales of Purdue University, published in the journal Applied Economics.
Instead of basing findings on surveys of what consumers recall buying, or disappearance data from the United States Department of Agriculture (USDA), the OSU-Purdue study drew on data from two stores of the same grocery chain in the Pacific Northwest, both from areas with very different socio-economic and ethnic demographics.
After looking at what’s known as own-price elasticities for individual fruits – predominantly apples, pears, bananas, oranges and grapes – Durham and Eales found consumers were more responsive to price than economists previously thought.
“If I have a surplus of grapes and I put them on sale, my apples and blueberries and other things will suffer. … Whereas in vegetables if I have an excess of lettuce and I drop the price on lettuce, I may pick up more people eating salads, and they’re also going to buy tomatoes and cucumbers for example.”
— Ben Campbell, University of Georgia
While recognizing it would be “heroic” to generalize from a data set of just two stores, the authors found elasticities were similar in both areas and called for more studies in different regions with the same methodology. Grapes were the most elastic of the fruits analyzed at between -1.62 and -1.67, while it will probably come as no surprise to produce executives that bananas were the most inelastic at -0.9-0.98.
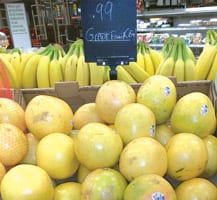
“The No. 1 single SKU (stock keeping unit) in the produce department is bananas, and when on promotion at a huge price reduction it has one of the lower volume increases,” says Dick Spezzano of Spezzano Consulting Services in Monrovia, CA, who was formerly VP of produce and floral at the supermarket chain Vons.
“This is usually due to the fact bananas have a limited storage life of three to six days, so buying a three-week supply is not what happens. Many vegetables fall into this category for the same reason,” he says.
This finding is backed up by observations from Dionysios Christou, vice president of marketing at Del Monte Fresh Produce in Coral Gables, FL, and he notes the dynamic is similar with tomatoes.
“With tomatoes you might see shifts in variety choices, but the total category volume typically would remain relatively flat,” says Christou.
“Viewed by consumers as staples in their shopping basket, both items are often purchased on a regular basis,” he says. “Consumers who enjoy these products week-in, week-out may find it hard to eat more, making it difficult to drive incremental sales even when the price promotion offered is compelling.”
Substitutes and Complements
Cornell’s Rickard says that while the fresh produce category is “pretty sticky”, there can be shifts for individual fruits and vegetables with the price of one commodity affecting demand for another.
“If the price comes down on apples, consumers are likely to buy more apples and less bananas, but apples are just part of this greater fruit and vegetable category,” he says. “It’s really just a question of how substitutable an individual fruit is.”
This relates to cross-price elasticity, an area where Ben Campbell, assistant professor in agricultural and applied economics at the University of Georgia, points out as an insightful distinction between fruits and vegetables.
“Vegetables tend to be a bit more on the complement side of things, whereas fruits are generally on the substitute side,” says Campbell.
“If I have a surplus of grapes and I put them on sale, my apples and blueberries and other things will suffer,” he says, adding peaches, cantaloupes, watermelons and plums are other commodities adversely impacted by cuts in table grape prices.
“Whereas in vegetables if I have an excess of lettuce and I drop the price on lettuce, I may pick up more people eating salads, and they’re also going to buy tomatoes and cucumbers for example.”
 On that note, in the OSU-Purdue study oranges were found to have a significant complementary relationship with fruits designated as ‘other’ at one store, meaning everything except apples, pears, bananas and grapes.
The authors questioned whether there might be a fruit salad effect for oranges.
“All other significant cross-price elasticities show that fruits are substitutes at both stores,” Durham and Eales said.
On the other side of the Atlantic, a 2011 study from the University of Reading in the U.K. found all food groups had complementary relationships with vegetables, meaning consumers tended to use any freed-up budgets on increased veggie expenditure.
The study, co-authored by Richard Tiffin, Kevin Balcombe, Matthew Salois and Ariane Kehlbacher, found reductions in prices for dairy and eggs had the most positive impact on vegetable demand, followed by alcohol.
For fruits and nuts these cross-price elasticity impacts were less pronounced, and it was found the category actually had a substitute relationship with meat and fish.
One produce marketer that has done relatively in-depth research into price responsiveness is Robinson Fresh of Eden Prairie, MN, but the company’s work has still “only begun to scratch the surface” according to director of category management Gina Garven.
Garven highlights some commodities like table grapes have many substitutes.
“Most shoppers view berries, particularly strawberries, as a substitute for them, but they also will substitute apples, citrus and stone fruit when in season if the price or quality doesn’t meet their expectations,” she says.
“Where this is the case, it’s imperative to understand the relationship between the two and what changes in the price of one is expected to do to the volume of another.
On the other hand, she notes products like avocados don’t really have any replacements.
“Shoppers will simply go to another store to find [avocados] or forfeit their plan to purchase altogether when the price or quality doesn’t meet their expectations,” she says.
“Shoppers will simply go to another store to find [avocados] or forfeit their plan to purchase altogether when the price or quality doesn’t meet their expectations.”
— Gina Garven, Robinson Fresh
“In this case, the substitution effect isn’t a factor for the commodity, but retail providers do have to think about what’s prepared with it and how the pricing of complementary items will impact sales.
“It’s not prudent to simply do what you’ve always done, even if you’ve gotten favorable results.”
John Pandol of Pandol Bros adds the “most cannibalizing” product for table grapes is North American cherries, although the same effect isn’t seen for cherries coming from the Southern Hemisphere.
“It’s just a tsunami and we hold our breath until the wave goes over us,” he says.
Dick Spezzano of Spezzano Consulting Services believes trade-off effects are often within categories. He provides a hypothetical example of green seedless grapes on promotion at $0.99/lb when conventional grapes are regularly sold at $1.99/lb and organic at $2.99/lb.
“The green grape promotion tends to hurt the volume of all the other grapes. In saying this, you may see a drop on the red and black conventional seedless grapes of 20 percent and on the organic a drop of 10 percent,” he says. “The overall ad ‘lift’ will more that make up for the lost volume.”
“This is true of the berry, apple, carrot, citrus and potato categories. However it is a great way to get conventional shoppers to try organic items,” Spezzano adds.
Similarly, when strawberries are on sale at a great price it can affect other berries; in vegetables there can be trade-offs between broccoli and cauliflower, as well as carrots with other veggies.
“Keep in mind the produce department has deep discounts on their ‘hot’ specials and great values on all other items in their ad,” he says. “Except for the EDLP (everyday low price) players like Walmart and Aldi, you create the fervor to buy more when on special because your food dollar can go so much further.”
 Andres Ocampo, director of operations at HLB Specialties in Fort Lauderdale, FL, claims there are complementary relationships within the tropical category that can be harnessed through cross-promotions.
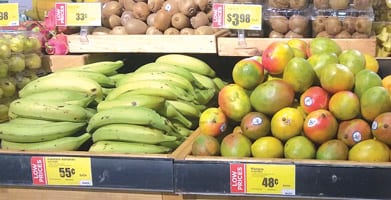
“From what we have done in the past, there might be a tropical push with the retailer where they might put pineapples, mangos and papayas on ad,” he says.
“Sometimes it’s a little hard to get all three items to be able to do promotional volumes and prices at the same time, but it does increase the impact of the ad. If you call it a tropical ad instead of a papaya ad or a mango ad, it does help.”
He adds that in the company’s experience, limes have proven a great complement to papayas as well.
“That’s probably the item they combine best with because some people like the mild flavor of the papaya but some people like to spike it with a bit of lime…there are opportunities there where they can incentivize consumption of both items.”
Spezzano adds the exposure of placing limes with beer – like placing mushrooms with steaks, lemons with fish and ripe avocados with chips – can increase sales by as much as 25-75%.
Crunching Numbers
The National Mango Board (NMB) in Orlando, FL has one of the most robust data sets of any commodity board for determining price responsiveness. But rules that govern these boards mean representatives cannot speculate on future pricing, while the group has a mission to promote the fruit from all origins.
This means the NMB’s director of research Leonardo Ortega cannot comment on elasticity for mangos from different origins, but he can discuss past observations and findings.
“What we found is that if you decrease or increase the price we see more effect on the number of people buying mangos than on the amount of mangos that each consumer buys.”
— Leonardo Ortega, National Mango Board
“We have been monitoring consumers since 2008. We interview approximately 1,000 consumers every month, and we ask them about mango consumption from the past two weeks,” says Ortega. “According to our data and the analysis done by Dr. Ronald Ward from the University of Florida, the price elasticity that we have is -1.6 – that means it’s elastic.”
This estimate comes from more than 100,000 data points taken through to 2017, and the research is ongoing.
“I mentioned the average elasticity but the elasticity is not a straight line. And this can go from -1.3 to -1.8, depending on the price,” says Ortega.
“For example, when we went from $0.70 per mango to $1.40 per mango, it started with an elasticity of -1.38, and when the price doubled the elasticity would be -1.8.”
As the NMB has such a strong data set, it also calculates elasticity as it pertains to market penetration and intensity.
“The market penetration is the percentage of people buying mangos, and the market intensity is the amount of mangos that each person buys,” he says. “What we found is that if you decrease or increase the price we see more effect on the number of people buying mangos than on the amount of mangos that each consumer buys.”
Garven from Robinson Fresh echoes these observations about changing elasticities along the demand curve.
“It’s common to describe price elasticity outputs simply in this way: ‘With a decrease in the price of 10 percent, an increase in volume of 20 percent is expected.’ While it’s sometimes true that the inverse works, it is not safe to assume it is that way always,” she says.
“You also cannot simply assume that given this statement a decrease in price of 20 percent would result in an expected increase in volume of 40 percent, which is double the original example. The elasticity curve is typically not straight.”
She says asparagus is a perfect example, with the curve of its regression model shaped more like a “hockey stick.”
“For most retailers when bunched, green asparagus is priced below $2.99/bunch, it’s relatively elastic,” she says. “The difference in sales volume when priced at $1.99/bunch is double, but when priced above that $2.99 mark, volume remains flat.
“If you are planning to put your retail price at $2.99/bunch, why not price it a little higher and improve profits? It’s unlikely to impact movement.”
Garven emphasizes price elasticity “absolutely changes over time.”
“For highly seasonal items, like watermelon or corn, the way shoppers respond to prices through the summer months looks very different to how they respond in the winter months,” she says.
“Longer-term trends are more difficult to measure because varieties change, store formats change, packaging changes, etcetera, but we think the more important long-term factor to pay attention to for a pricing strategy is the consumer and shopper.”
She points to coconuts and Honeycrisp apples as good examples where elasticities change depending on location and the time of year. “In Hawaii, there might not have that wiggle room in pricing of coconuts, but in locations not as close to production, there probably is,” she says.
“Here in Minnesota, where the Honeycrisp apple was developed, shoppers expect to see this in every store they shop in the fall, and these items are likely to be more sensitive to price changes because of its availability. However, later in the season as supply becomes scarcer, this variety becomes more inelastic and less sensitive to price changes.”
The Art of Pricing: Elasticity, Expectations and Stability
While the price elasticity of demand can be calculated for a specific place and time at a standardized weight, demand is ultimately the product of expectations. When you consider the willingness of a consumer to buy a product, the psychology around the purchase cannot be underestimated.
“It sounds simple, but one of the most common pit-falls we see when we go into a retail provider to consult on pricing is that retail providers tend to do the same type of promotion for an item,” says Gina Garven of Robinson Fresh.
“Ninety-nine cents per each, as an example, is often repeated without testing other options. We can measure mathematically how shoppers respond to that change in price, but the reality is that they’ll also respond differently to different versions of this price.”
Instead of pricing products at $0.99 each, Garven says they can be marked as two for $2, or have them sold at $2 each with a buy-one-get-one-free promotion.
“All of these versions result in basically the same price, but shoppers will respond differently, which of course impacts the volume—the elasticity measures that result. This is the art of pricing.”
“The ups and downs may be responsible for the younger generation not eating as much produce, because its prices are unknown and kind of unreliable.”
— John Pandol, Pandol Bros.
Pandol believes the 99-cent model is unsustainable for table grapes, and speculates high-low pricing may be hurting the produce industry generally because prices are “just so all over the board.”
“On a cost basis for a 99-cent retail price, somebody’s losing somewhere in the chain there,” he says, claiming there is a substantial piece of the market where retail and wholesale prices are “divorced.”
“One of the other pricing strategies that we think tends to negatively affect demand is these extreme high-lows where there might be 200 percent between the regular price and the ad price.
“The ups and downs may be responsible for the younger generation not eating as much produce, because its prices are unknown and kind of unreliable.”
On a psychological note, Pandol talks about how consumers don’t seem to notice the swing in retail prices per pound as much for berries, with the size of packages changing throughout the season while the price per package stays more consistent.
“I would say most consumers don’t do long division. They look at the package price,” he says.
“Someone said to me one time: ‘I don’t know why potatoes are in 5- and 10-pound units, because it’s easy to calculate the price per pound. They should be like some products in the store that are really oddball sizes.’ Laundry detergent is one of those.”
Christou of Del Monte Fresh Produce also alludes to the psychological elements of pricing, highlighting retailers may be tempted to alter their programs to hit certain price points.
“For example, a customer buying large pineapples or melons may be tempted to consider a smaller size to attain a reduced selling price per unit and create a false sense of value to the consumer,” he says.
Spezzano thinks consumers expect produce pricing to fluctuate with a lot of specials as they understand supply moves and there is seasonality that is reflected in retail pricing.
But if a retailer features items too frequently, he believes “the consumer will wait for the specials to buy and lay off of non-promotional purchases”.
“Not all items in the ad are at below cost, at cost and a bit above cost as many of the items in the ad are at a profitable level,” he says, citing value-added salads, value-added vegetables and semi-perishable items as good examples.
“One longer-term trend we do see impacting the marketplace is the value shoppers place on convenience and packaging,” adds Garven. “The convenience shoppers are typically less price sensitive across all commodities – they’re willing to pay more for the value-ad that comes with that type of product.”
Christou says consumers are more aware of price fluctuations on products they purchase often. “Consumers who see staples fluctuating may choose to shop around in search of more consistent pricing on the products that they choose to buy regularly,” he says. “In response, retailers may choose to maintain steady pricing on these items, making more or less profit as FOB (freight on board) pricing fluctuates.”
 Christou cautions that while price rigidity with low prices on everyday products can benefit consumers, this may also lead to pressure being placed on growers to lower their prices to unsustainable levels.
For the Del Monte executive, the level of price responsiveness is driven by consumer perceptions over whether an item is a staple or a luxury.
“Where the product is considered a staple, consumers are likely to make a purchase even if the price increases, while luxury items will be given up if the price exceeds consumer expectations,” he says.
“Consumers respond positively to price promotions on grapes, berries and pineapples,” he says.
But what methods can retailers employ to lift sales of inelastic staples?
“For a staple item, retailers can support a price promotion by helping consumers to identify new day parts in which the product can be consumed,” says Christou.
“Since bananas are often eaten at breakfast or as a morning snack, to improve sales during the promotion a retailer could, for example, display recipe cards highlighting how bananas can be incorporated into an evening meal.”
“Promoting packaged options can also entice them to buy larger volumes than they might have originally planned,” adds Garven. “If retail providers know how many each shopper typically purchases at one time, it can quickly be assessed what it would take to get shoppers to buy more in one trip.”
WHEN ELASTICITY CHANGES: STAYING AHEAD OF THE CURVE
Limes are a notoriously inelastic fruit given their necessity in many cocktails. HLB Specialties, Fort Lauderdale, FL, only imports organic limes, which Andres Ocampo, director of operations, believes brings more protection against price responsiveness.
“But also in conventional limes I remember three years ago when they were hitting crazy numbers like $150 per box,” he says. “They had become staples so foodservice and some retailers had to have the limes anyway.”
“Some people were trying to replace limes with lemons, but just temporarily. They still had to have the limes as soon as they were made available. I would say with limes that threshold was very high.”
The threshold he is referring to is the point on the demand curve where elasticity starts to change, and this is perhaps the most complicated part of applying responsiveness-based pricing strategies; it’s where the science becomes more of an art.
“This sort of textbook illustration where we show a straight line and talk about elasticity and think people’s degree of sensitivity remains the same regardless of what today’s price is, I think that’s wrong,” says Brad Rickard, associate professor of applied economics at Cornell University.
“These threshold points are like little kinks in that curve, so you hit that threshold point, and all of a sudden, that line is just actually a little backwards escalator where it kinks in or out and that defines a new price elasticity,” he says. “That’s often how we try to model it.”
Ocampo says that threshold point where demand becomes more elastic is clearly seen in papayas.
“Let’s say we were selling papayas at $17 per box. If we got to $20-21, we don’t notice too much of a change in volume,” he says. “It seems to me that if it gets to a point where prices are beyond $23-24, then we see a significant drop.”
And the equation is often, but not always, similar in the opposite direction. You can cut price and volume doesn’t really move much, unless you’re undertaking a concerted effort to bring attention to the discount.
As is the case with bananas, Ocampo highlights the difficulties of moving extra volumes of other inelastic items.
“Let’s say the retail price for a lime is $1 a piece. If they drop it to 90 cents or 80 cents without doing any special ad or advertising, I don’t think there’s going to be an uptick on purchases of limes,” he says.
He explains the situation for a niche product like goldenberries is similar, having really only made significant traction in foodservice.
“You’re talking about hotels and restaurants that either use it or not,” he says. “If a chef tells his purchasing department that he needs that fruit, they are willing to make concessions and find it; only for the cheapest available price but the point is they need the product.
“The same goes the other way. If I don’t want it, I’m not going to buy it even if it’s almost for free. The more exotic the item, the less flexibility there is in price.”
Ocampo observes that elasticity can change from between seasons and sources of origin as well.
“I see that with mangos for example. During the Mexican season the prices of mangos are very low, and you can promote aggressively and move volumes,” he says. “When the season from South America is on, obviously the prices are different.”
THE ELASTICITY OF ORGANIC
Ben Campbell, assistant professor in agricultural and applied economics at the University of Georgia, has a focus on pricing strategies for labels, particularly for organic, local and sustainable items.
“There are groups of consumers that are highly price insensitive to organic,” he says. “It’s a relatively small group, probably 10-15 percent of consumers depending on the product.”
Campbell explains in fruit and vegetables the average price increase or premium for organic compared to conventional would be estimated at around 46%.
“If you start driving up price much more than that, you’re going to have a lot more people switch off than are going to stay, so revenues are going to go down,” he says.
“You have that group who you can charge those higher prices to and they’re not going to switch off if you raise the price a little bit,” he says. “The fine tinkering with price is how much can I drop price and grab that extra group that really cares about price but doesn’t really care about organic, but not lose the sales I get from this smaller group.”
Last year, researchers from the University of Kentucky’s Department of Agricultural Economics (GwanSeon Kim, Tyler B. Mark and Michael R. Reed) and the National Institute of Agricultural Sciences in South Korea (Jun Ho Seok), investigated price relationships between organic and conventional carrots, tomatoes and lettuce in the U.S.
Using Nielsen scanner data from 2006 to 2015, the authors found positive long-run price relationships between organic and conventional in carrots and tomatoes. The correlation was that a 1 percent rise in the price of organic carrots or tomatoes led to a greater rise in prices of the conventional product.
“We also find that there is no cross-price relationship between organic and conventional lettuce in all regimes, which implies that consumers tend to consider organic and conventional lettuce as different goods,” the authors said.
The researchers discovered U.S. consumers recognized organic and conventional carrots and tomatoes as “limited substitutable goods.”
“These results provide marketing opportunities to grocery store managers for these vegetables due to their limited substitutability,” the authors said.
“Managers could take advantage of this situation by setting higher price margins on lettuce and tomatoes between organic and conventional products to increase profits.”
For UGA’s Campbell, the right pricing strategy comes down to understanding your consumer base in order to make the right decisions.
“For example Whole Foods … they know who their shoppers are and they’re charging premiums because they know the customers coming in will pay a higher price,” he says. “Is an apple you buy at Whole Foods different to an apple you buy somewhere else? Probably not, but they know who the clientele is and they can charge those prices.”
He says products labeled as local also drive premiums, but the nature of demand is a bit different as the topic isn’t as controversial.
“In local you have the same thing, but I wouldn’t say the price premiums are as large as you see in organic,” he says.
“Now there are many retailers in organic, and it’s sort of lost some of its luster for a lot of people,” he says. “Local on the other hand hasn’t, and you have groups of consumers who will pay more for it compared to non-local, but generally local doesn’t have that dichotomy of perceptions like organic does.
16 of 16 article in Produce Business February 2019

Have a story to share?
Take a place at Produce Business